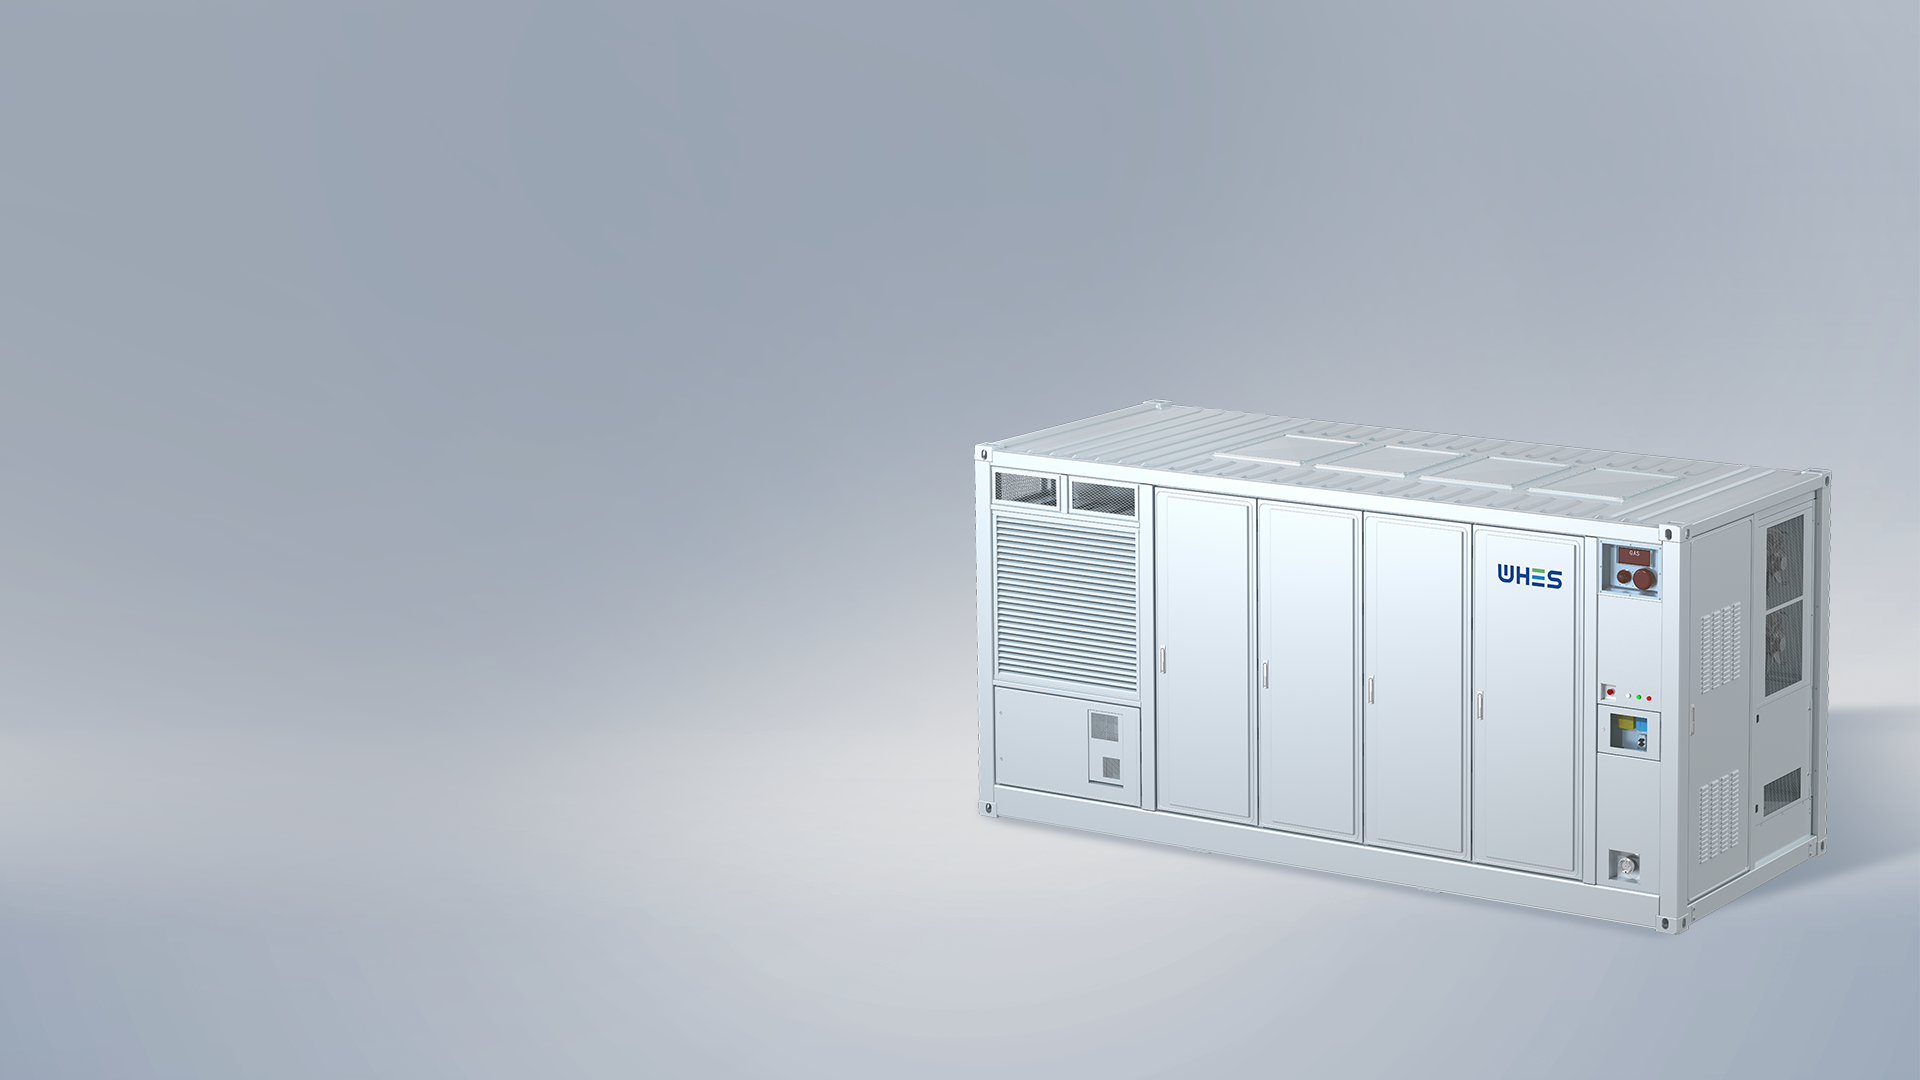
The problem — why small losses become big headaches
When you’re developing utility‑scale battery systems, the headline numbers — energy capacity and power rating — are only half the story. Hidden inefficiencies from round‑trip losses and auxiliary load draws quietly erode usable throughput, distort performance models and bite into revenue. That’s especially true for real projects like the Hornsdale Power Reserve in South Australia, where operational efficiency directly affects grid services and dispatch economics. If you’re running R&D or validation labs for utility scale battery storage, you need a problem‑first metrology approach: identify where the energy is going, quantify it precisely, and close the measurement gaps.
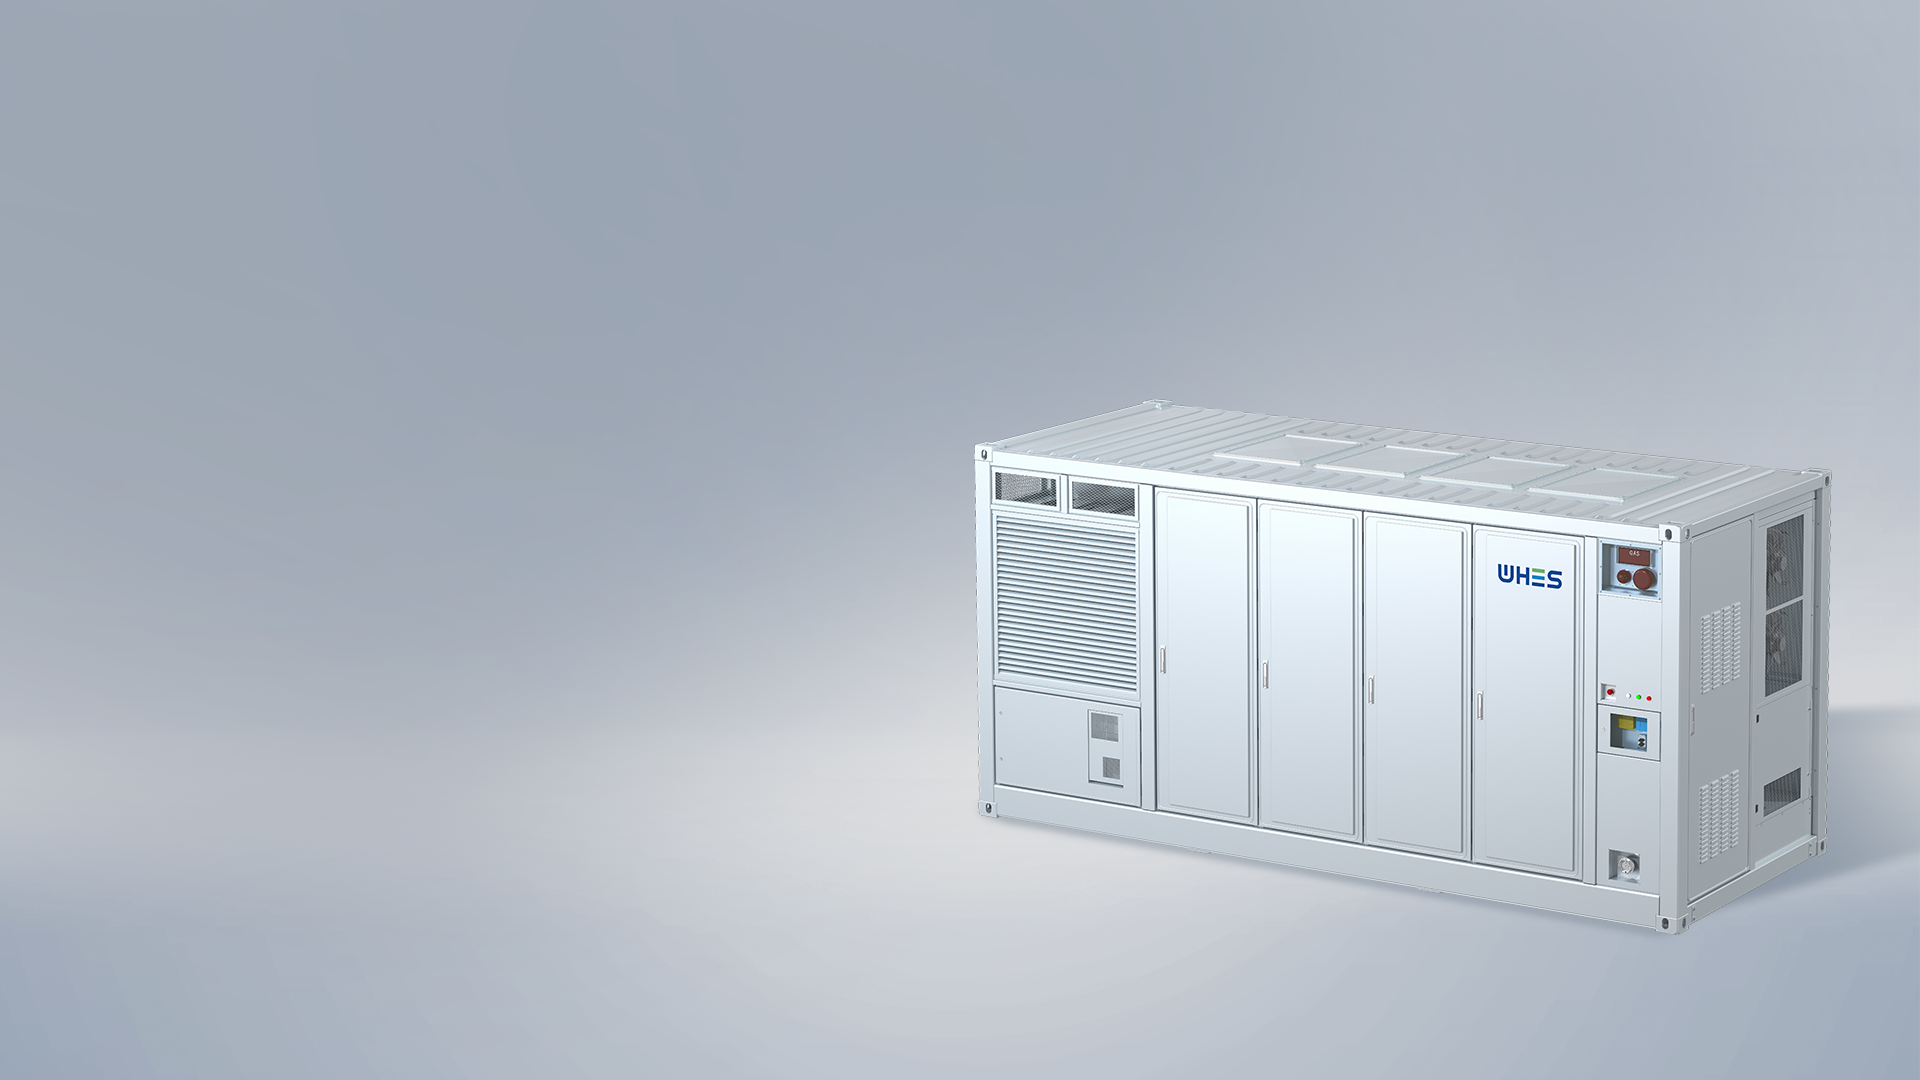
Why precise metrology matters
Round‑trip efficiency (RTE) tells you how much energy returns after a full charge–discharge cycle, but RTE alone can be misleading if auxiliary loads — BMS telemetry, cooling fans, control electronics — aren’t accounted for. In commercial settings, parasitic loads can shave off several percentage points from apparent RTE, shifting business cases and warranty claims. Good metrology protects your design choices, informs thermal management and helps you size inverters and balance‑of‑plant correctly.
Core measurements to prioritise
Start with a short list of high‑value metrics: cumulative charge in/out (Wh), instantaneous and integrated auxiliary draw (W, Wh), state of charge (SoC) mapping, and temperature profiles. You’ll want synchronized timestamps across power analysers and the BMS, and attention to inverter standby modes and soft‑start currents. Use calibrated shunts or precision current sensors and log at a resolution that captures transient events during switching — those spikes often explain mysterious energy losses.
Practical test setup and methodology
Design your test rig with isolation and repeatability in mind. A typical setup includes precision source‑measure units or grid‑tied power analysers, a data‑acquisition system tied to the BMS, and separate metering for auxiliary buses (DC control, HVAC, fans). Place sensors close to the device under test to avoid wiring losses skewing results. Run cycles at different SoC windows and C‑rates — losses aren’t linear. Also, repeat runs across ambient temperature ranges to characterise thermal sensitivity and ageing interactions.
Signal integrity and data alignment — the nitty gritty
Time alignment is non‑negotiable. If your power analyser and BMS clocks drift, you’ll misattribute energy flows. Use GPS or NTP synchronisation and log at consistent sample rates. Watch out for aliases when you downsample — you might miss short auxiliary spikes from contactors or fan inrush that add up over thousands of cycles. And label everything clearly in your dataset: bus IDs, measurement points, and firmware versions. Small bookkeeping errors translate into big analytical headaches later — trust me, you’ll appreciate the discipline.
Common mistakes teams make (and how to dodge them)
Teams often assume auxiliary loads are constant — they’re not. Fans ramp, heaters kick in based on SoC or temperature, and communications can spike during firmware updates. Another misstep is relying solely on integrated RTE without separate auxiliary accounting; that conflates cell losses with overhead. Finally, neglecting environmental control during tests produces noisy baselines. A neat fix: define a ‘zero‑load’ baseline for auxiliaries, then run incremental tests adding one subsystem at a time. This isolates causality and speeds troubleshooting — and yes, it takes more discipline up front but saves time later.
Case snapshot: translating lab results to field expectations
In field deployments like Hornsdale, operating conditions and grid dispatch patterns differ from lab cycles. Use representative duty cycles from historical dispatch data when validating models — grid‑scale units often face frequent partial cycles rather than textbook full cycles. Adjust your financial models to reflect measured auxiliary parasitics and observed degradation rates; that will change projected capacity over warranty periods. If your prototype shows marginally lower RTE in high ambient heat, rethink thermal design or accept a revised energy yield estimate.
Advisory — three golden rules for metrology and selection
1) Measure separately: always meter cell/battery strings and auxiliary buses independently so you can report net vs gross RTE. 2) Synchronise and sample: ensure sub‑second timestamp alignment across BMS and power analysers to catch transient draws and switching events. 3) Validate in situ: supplement lab runs with representative field cycles and temperature envelopes before finalising system specs.
Applying those rules will make your performance claims defensible and your procurement choices clearer — and when you need a partner that understands both the metrology and the realities of deployment, solutions from providers who design for the grid edge matter. For practical, deployable insight into utility deployments and system behaviour, consider how a tested platform like WHES fits into your validation pipeline. —