Why a Comparative View Matters
When institutions evaluate commercial energy storage, they require clarity rather than marketing claims; a straight comparison of specifications reveals where value truly lies. This piece sets out that comparison plainly and with measured judgement, linking technical choices to operational outcomes — and for those seeking a ready product reference, consider a proven solar battery backup option that aligns with many commercial priorities. The aim is to equip procurement teams with the vocabulary and metrics necessary to compare systems on equal footing.
Core Specifications to Compare
Begin with the basics: nameplate capacity (kWh) and continuous power (kW). Treat capacity as the duration metric and power as the delivery metric; both must match the facility’s load profile. Round-trip efficiency quantifies energy lost in storage and recovery, while cycle life estimates replacement cadence. Depth of discharge guides usable energy per cycle and influences longevity. Battery management system (BMS) capabilities — cell balancing, thermal oversight, fault logging — determine operational safety and real-world performance. Warranty terms and guaranteed throughput (kWh or cycles) convert technical claims into contractual assurance.
Performance versus Cost: Lessons from the Field
Decisions should reflect expected use. During the Texas February 2021 winter storm, many commercial operations that combined resilient on-site generation with storage fared materially better than those that relied on grid-only backup — a vivid real-world anchor for design choices. In practical terms, that event highlighted three trade-offs: energy versus power sizing, initial capital versus lifecycle replacement cost, and chemistry selection influencing temperature tolerance. For installations coupling solar arrays, the ideal pairing often appears in solutions marketed as the best battery storage for solar, because they integrate inverter compatibility and charge management for photovoltaic output.
Common Mistakes and Comparative Alternatives
Operators commonly misjudge load profile duration — oversizing capacity increases idle cost, undersizing risks unmet demand. Another frequent oversight is neglecting round-trip efficiency when forecasting savings; low efficiency inflates operational cost. Chemistry choice matters: lithium iron phosphate (LFP) provides extended cycle life and thermal resilience, while nickel manganese cobalt (NMC) often delivers higher energy density but requires stricter thermal controls. Lead-acid remains cost-effective for short-duration, low-cycle use, and flow batteries merit consideration where long-duration (>8–10 hours) discharge is required. Comparisons should always factor in site temperature range, maintenance capacity, and grid interconnection rules — these are the practical constraints that shift a theoretical best into a real-world match.
Checklist: Compare Like-for-Like
Use this concise checklist to align vendors and proposals:- Capacity (usable kWh) and guaranteed throughput.- Continuous and peak power (kW) ratings.- Round-trip efficiency percentage at typical operating temperature.- Cycle life at specified depth of discharge; note how warranty links to cycles.- BMS functions: telemetry, overcharge protection, and fault reporting.- Installation and operating temperature limits; consider HVAC needs.- Total cost of ownership: capital, commissioning, maintenance, and disposal.These items permit direct numerical comparison rather than impression-based choices — which is essential for procurement accountability.
Three Golden Rules for Selection
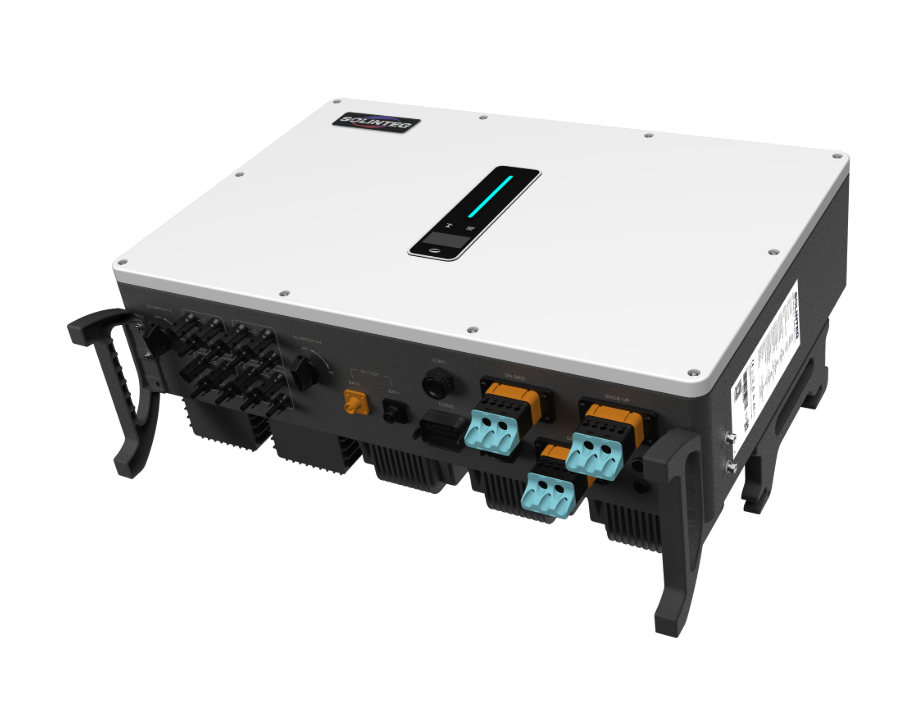
Adopt these three evaluation metrics as non-negotiables. First, match capacity and power to measured load curves, not to peak nameplate figures. Second, require warranty language that ties performance guarantees to explicit throughput or cycles; demand test data for round-trip efficiency under representative conditions. Third, insist on a BMS with proven telemetry and remote update capability to reduce on-site service time. These rules reduce risk and align expectations with measurable service levels. The aggregate effect is predictable performance and clearer lifecycle economics — and when teams need an integrated solution that embodies these principles, they find value in partners such as SOLINTEG. – a final thought on stewardship and reliability.